Monitor applications via STACKIT Observability
Last updated on
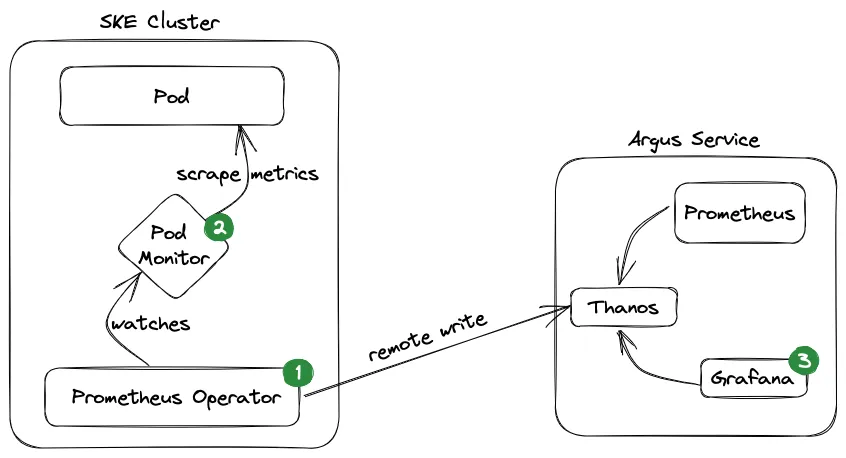
This section shows the process, how customer workloads on SKE can be monitored using the STACKIT Observability service.
Overview
Section titled “Overview”Here is a high-level architecture diagram of the monitoring setup:
Prerequisites
Section titled “Prerequisites”-
You have ordered the following services:
-
You have basic knowledge of Prometheus, Grafana and Kubernetes.
-
You have verified your Kubernetes cluster using the
kubectlcommand.kubectlis a command line tool which allows you to run commands against Kubernetes clusters:Terminal window kubectl get nodesNAME STATUS ROLES AGE VERSIONshoot--<cluster-name>--<worker-pool>-<node-id> Ready <none> 19d <kubernetes-version>shoot--<cluster-name>--<worker-pool>-<node-id> Ready <none> 19d <kubernetes-version>
1. Deploy the Prometheus operator on your SKE cluster
Section titled “1. Deploy the Prometheus operator on your SKE cluster”curl -sL https://github.com/prometheus-operator/prometheus-operator/releases/download/v0.92.1/bundle.yaml | kubectl apply -f -Pin the version to ensure reproducible behaviour.
Create credentials for the Observability Service via the STACKIT API or the STACKIT Portal. The credentials JSON contains the fields username, password, and urls.pushMetricsUrl.
Create a Kubernetes secret with your Observability credentials:
kubectl create secret generic observabilitysecret \ --from-literal=username='<your_observability_username>'\ --from-literal=password='<your_observability_password>'\ -n defaultNext you need to create a Prometheus instance in order to scrape your metrics and push them to Observability.
In the example below we created a PodMonitor in order to scrape the metrics of a pod. You could also create a ServiceMonitor to scrape metrics there.
Here you have to use your pushMetricsUrl which you got with your username and password.
apiVersion: v1kind: ServiceAccountmetadata: name: prometheus---apiVersion: rbac.authorization.k8s.io/v1kind: ClusterRolemetadata: name: prometheusrules: - apiGroups: [""] resources: - nodes - nodes/metrics - services - endpoints - pods verbs: ["get", "list", "watch"] - apiGroups: [""] resources: - configmaps verbs: ["get"] - apiGroups: - networking.k8s.io resources: - ingresses verbs: ["get", "list", "watch"] - nonResourceURLs: ["/metrics"] verbs: ["get"]---apiVersion: rbac.authorization.k8s.io/v1kind: ClusterRoleBindingmetadata: name: prometheusroleRef: apiGroup: rbac.authorization.k8s.io kind: ClusterRole name: prometheussubjects: - kind: ServiceAccount name: prometheus namespace: default---apiVersion: monitoring.coreos.com/v1kind: Prometheusmetadata: name: prometheusspec: serviceAccountName: prometheus podMonitorSelector: matchLabels: team: frontend resources: requests: memory: 400Mi enableAdminAPI: false remoteWrite: - url: "<your_pushMetrics_URL>" basicAuth: username: name: observabilitysecret key: username password: name: observabilitysecret key: password---apiVersion: v1kind: Servicemetadata: name: prometheusspec: type: ClusterIP ports: - port: 80 targetPort: http protocol: TCP name: http selector: prometheus: prometheus2. Create a PodMonitor for your application
Section titled “2. Create a PodMonitor for your application”In order to monitor your application, you need to create a PodMonitor to scrape the metrics of your pod:
apiVersion: monitoring.coreos.com/v1kind: PodMonitormetadata: name: product-demo labels: team: frontendspec: selector: matchLabels: app: product-demo podMetricsEndpoints: - port: metrics namespaceSelector: any: true3. Visualize your metrics in Grafana
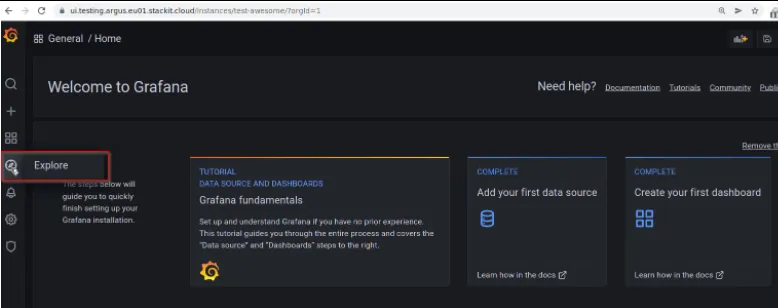
Section titled “3. Visualize your metrics in Grafana”Get your grafanaUrl, grafanaAdminUsername and grafanaAdminPassword from the Observability credentials JSON you created in step 1. Open the grafanaUrl in browser and use your Grafana credentials. Click the Explore symbol:
Check your metrics using a simple query. Query up{job="product-demo"} to verify that the PodMonitor created in step 2 is scraping your application pods:
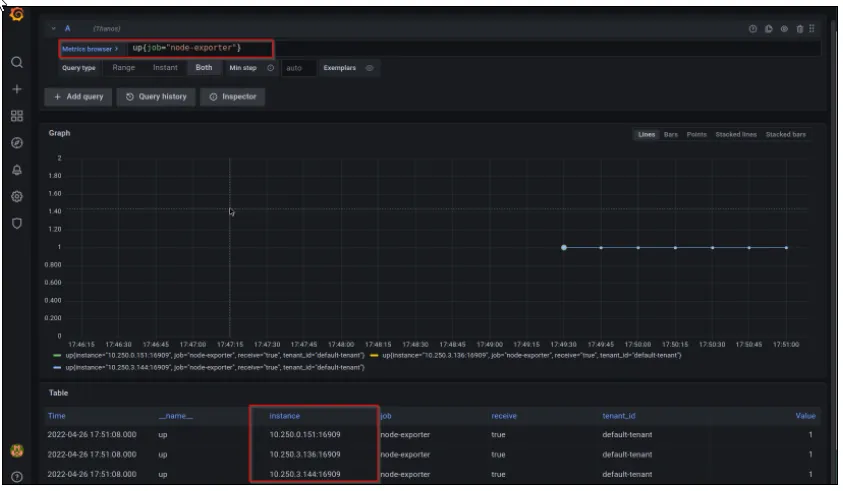
You can verify your metrics by comparing the IPs from your Kubernetes node details using below command:
kubectl get nodes -o wide
NAME STATUS ROLES AGE VERSION INTERNAL-IP EXTERNAL-IP OS-IMAGE KERNEL-VERSION CONTAINER-RUNTIMEshoot--<cluster-name>--<worker-pool>-<node-id> Ready <none> 4h8m <kubernetes-version> <internal-ip> <none> Flatcar Container Linux by Kinvolk <os-version> (Oklo)shoot--<cluster-name>--<worker-pool>-<node-id> Ready <none> 20d <kubernetes-version> <internal-ip> <none> Flatcar Container Linux by Kinvolk <os-version> (Oklo)shoot--<cluster-name>--<worker-pool>-<node-id> Ready <none> 20d <kubernetes-version> <internal-ip> <none> Flatcar Container Linux by Kinvolk <os-version> (Oklo)